Digital Humanities Sandbox Goes to the Congo

Or, Speculations in Computational Evolutionary Psychology

Note: This version of the post has been revised from an earlier version in which I suggested that the distribution in the first chart followed a power law. Cosma Shalizi checked it for me and it’s not a power law distribution. It’s an exponential distribution.

So, I’ve been exploring Conrad’s Heart of Darkness. In the last two posts I’ve examined one paragraph in the text, the so-called nexus. It’s the longest paragraph in the text, it’s structurally central, and it covers a lot of semantic territory.

OK, but what about the other paragraphs.

What about them?

Aren’t you going to look at them?

Well, yeah, but I sure don’t have time to troll through them like I did the nexus. I mean, that post stretched from here to Sunday.

I get your point. Why don’t you do the Moretti thing?

Moretti thing?

You know, distant reading.

Distant reading? You mean count something? Count what?

How about paragraph length?

What’ll that get me?

I don’t know. Just do it. I mean, you already know that the nexus is the longest paragraph in the text. There must be something going on with that. Mess around and see if something turns up.


* * * * *
I did and it did.

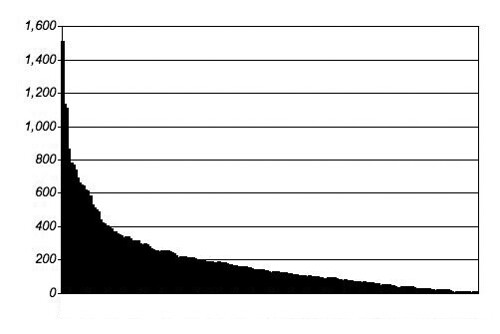
I used the MSWord word-count tool to count the words in every paragraph in the text. All 198 of them. One at a time. Real tedious stuff. Then I loaded the results into a spreadsheet and created a bar chart showing paragraph length from longest to shortest:

HD whole ordered 2 Continue reading “Digital Humanities Sandbox Goes to the Congo”

SpecGram: Phonotronic Energy Reserves and the Tiny Phoneme Hypothesis

An article in this month’s Speculative Grammarian considers whether phonotronic energy could account for the results of Atkinson (2011) (commented on here) which support a serial founder effect on phoneme inventory.

The article demonstrates two things:

  1. The effects on phonotronic energy correlate well with phoneme inventory size
  2. I’m not the only one doing bonkers correlations

A random walk model of linguistic complexity

EDIT: Since writing this post, I have discovered a major flaw with the conclusion which is described here.

One of the problems with large-scale statistical analyses of linguistic typologies is the temporal resolution of the data.  Because we only typically have single measurements for populations, we can’t see the dynamics of the system.  A correlation between two variables that exists now may be an accident of more complex dynamics.  For instance, Lupyan & Dale (2010) find a statistically significant correlation between a linguistic population’s size and its morphological complexity.  One hypothesis is that the language of larger populations are adapting to adult learners as they comes into contact with other languages.  Hay & Bauer (2007) also link demography with phonemic diversity.  However, it’s not clear how robust these relationships are over time, because of a lack of data on these variables in the past.

To test this, a benchmark is needed.  One method is to use careful statistical controls, such as controlling for the area that the language is spoken in, the density of the population etc.  However, these data also tend to be synchronic.  Another method is to compare the results against the predictions of a simple model.  Here, I propose a simple model based on a dynamic where cultural variants in small populations change more rapidly than those in large populations.  This models the stochastic nature of small samples (see the introduction of Atkinson, 2011 for a brief review of this idea).  This model tests whether chaotic dynamics lead to periods of apparent correlation between variables.  Source code for this model is available at the bottom.

Continue reading “A random walk model of linguistic complexity”

Linguistic interactions in the UK

I just heard a talk by social network creator extraordinaire Clio Andris about redefining regional boundaries in the UK based on telecommunications data.  Her group took data from 12 billion telephone calls made over the space of a month and created a social network based on this (Ratti et al. , 2010). This network was then used to calculate how closely connected two neighbouring locations were. By optimising the spectral modularity, the best-fitting boundaries could be defined.

Here’s a video demonstration:

The data is fascinating, but there is little explanation.  Here’s one of the maps (left) compared with a map of regional accents and a map of rail transport links (right):

A perceptual map of dialects, from Montgomery, C. (2007) Northern English Dialects: A perceptual approach, PhD thesis. pdf


A comparison of the two experiments.

One of the first things that struck me was the similarity with a map of regional accents (apologies for the quality of the accent map – I couldn’t find the one I was looking for).  Apparently, people are talking to people that sound like them.  Or, people who talk to each other sound like each other.  This isn’t covered in the paper, but seems like an important issue.

Secondly, the rail links also seem to form the ‘backbones’ of the communications regions.  This is also mentioned in the paper.  However, these two features are linked.

Coming from Wales, the important fit here is the three-way split in Wales.  South Wales feels like a different country to North Wales – culturally and linguistically.  However, both are linked by having large amounts of natural resources: Coal in South Wales and slate in North Wales.  This lead to massive migration into cities in the north and south, and rail links were set up to extract these resources to London or the nearest ports:  Cardiff in the south and Liverpool in the north.  Thus, it’s still a real pain to get from North Wales to South Wales.  The picture is somewhat true of the east and west sides of the north of England.

So, the natural resources concentrated people and transport links.  However, it also concentrated political views.  The large migrant community in Wales, working for little pay in large mine institutions, became unionised.  Socialism emerged, promoting political movements that lead to the minimum wage.

The point being, natural resources, transport links and politics are connected with some being historically dependent on each other.  This is, perhaps, precisely why splitting the nation by who speaks to who is a good measure of political regions.  It would be fascinating to see how linguistic divisions interact with these variables.

Ratti, Carlo, Sobolevsky, Stanislav, Calabrese, Francesco, Andris, Clio, Reades, Jonathan, Martino, Mauro, Claxton, Rob, & Strogatz, Steven H. (2010). Redrawing the map of Great Britain from a network of human interaction PLoS ONE, 5

Creative cultural transmission as chaotic sampling

This post was chosen as an Editor's Selection for ResearchBlogging.orgLast week I attended a lecture by Liz Bradley on chaos.  Chaos has been used to create variations on musical and dance sequences (Dabby, 2008; Bradley & Stuart, 1998).  I was interested to see whether this technique could be iterated and applied to birdsong or other culturally transmitted systems.  I present a model of creative cultural transmission based on this.

Continue reading “Creative cultural transmission as chaotic sampling”

Cultural Evolution and the Impending Singularity

Prof. Alfred Hubler is an actual mad professor who is a danger to life as we know it.  In a talk this evening he went from ball bearings in castor oil to hyper-advanced machine intelligence and from some bits of string to the boundary conditions of the universe.  Hubler suggests that he is building a hyper-intelligent computer.  However, will hyper-intelligent machines actually give us a better scientific understanding of the universe, or will they just spend their time playing Tetris?

Let him take you on a journey…

Continue reading “Cultural Evolution and the Impending Singularity”

Categorising languages through network modularity

Today I’ve been learning more about network structure (from Cris Moore) and I’ve applied my poor understanding and overconfidence to find language families from etymology data!

Here’s what I understand so far (see Clauset, Moore, &  Newman, 2008):  The modularity of a network is a measure of how many ‘communities’ it has.  An optimal modularity will split the graph to maximise the average degree within modules or clusters.  You can search all the possible clusterings to find this optimum.  I’m still hazy on how this is actually done, and you can extend this to find hierarchies like phylogenetics, but without some assumptions.  Luckily, there’s a network analysis program called gephi that does this automatically!

Continue reading “Categorising languages through network modularity”

Academic Networking

Who are the movers and shakers in your field?  You can use social network theory on your bibliographies to find out:

Today I learned about some studies looking at social networks constructed from bibliographic data (from Mark Newman, see Newman 2001 or Said et al. 2008) .  Nodes on a graph represent authors and edges are added if those authors have co-authored a paper.

I scripted a little tool to construct such a graph from bibtex files – the bibliographic data files used with latex.  The Language Evolution and Computation Bibliography – a list of the most relevant papers in the field – is available in bibtex format.

You can look at the program using the online Academic Networking application that I scripted today, or upload your own bibtex file to find out who the movers and shakers are in your field.  Soon, I hope to add an automatic graph-visualisation, too.

Continue reading “Academic Networking”

The end of universals?

Woah, I just read some of the responses to Dunn et al. (2011) “Evolved structure of language shows lineage-specific trends in word-order universals” (language log here, Replicated Typo coverage here).  It’s come in for a lot of flack.  One concern raised at the LEC was that, considering an extreme interpretation, there may be no affect of universal biases on language structure.  This goes against Generativist approaches, but also the Evolutionary approach adopted by LEC-types.  For instance, Kirby, Dowman & Griffiths (2007) suggest that there are weak universal biases which are amplified by culture.  But there should be some trace of universality none the less.

Below is the relationship diagram for Indo-European and Uto-Aztecan feature dependencies from Dunn et al..  Bolder lines indicate stronger dependencies.  They appear to have different dependencies- only one is shared (Genitive-Noun and Object-Verb).

However, I looked at the median Bayes Factors for each of the possible dependencies (available in the supplementary materials).  These are the raw numbers that the above diagrams are based on.  If the dependencies’ strength rank in roughly the same order, they will have a high Spearman rank correlation.

Spearman Rank Correlation Indo-European Austronesian
Uto-Aztecan 0.39, p = 0.04 0.25, p = 0.19
Indo-European -0.13, p = 0.49

Spearman rank correlation coefficients and p-values for Bayes Factors for different dependency pairs in different language families.  Bantu was excluded because of missing feature data.

Although the Indo-European and Uto-Aztecan families have different strong dependencies, have similar rankings of those dependencies.  That is, two features with a weak dependency in an Indo-European language tend to have a weak dependency in Uto-Aztecan language, and the same is true of strong dependencies.  The same is true to some degree for Uto-Aztecan and Austronesian languages.  This might suggest that there are, in fact, universal weak biases lurking beneath the surface. Lucky for us.

However, this does not hold between Indo-European and Austronesian language families.  Actually, I have no idea whether a simple correlation between Bayes Factors makes any sense after hundreds of computer hours of advanced phylogenetic statistics, but the differences may be less striking than the diagram suggests.

UPDATE:

As Simon Greenhill points out below, the statistics are not at all conclusive.  However, I’m adding the graphs for all Bayes Factors (these are made directly from the Bayes Factors in the Supplementary Material):

Austronesian:                                                             Bantu:

Indo-European:                                                            Uto-Aztecan:

Michael Dunn,, Simon J. Greenhill,, Stephen C. Levinson, & & Russell D. Gray (2011). Evolved structure of language shows lineage-specific trends in word-order universals Nature, 473, 79-82