Language scientists in Nijmegen have been showing off their artistic side, capturing their research in photography. Head over to Taal in Beeld for a look at the entries – some of them are really stunning.
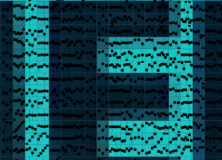
My entry was a picture of my fieldsite (my computer), made up of 36,864 graphs which show how every linguistic variable in the World Atlas of Language Structures correlates with every other variable. You can see it here. It’s inspired by my work with James Winters on spurious correlations in cultural traits.
I’m a computational linguist who looks at cross-cultural patterns in typology. With increasing amounts of data available for free, correlations are being discovered all the time between unlikely variables: Future tense and economic decisions; altitude and ejective sounds; linguistic gender and political power; linguistic diversity and traffic accidents. There’s a rush to discover interesting correlations, but actually little rigour in how the statistics are controlled.
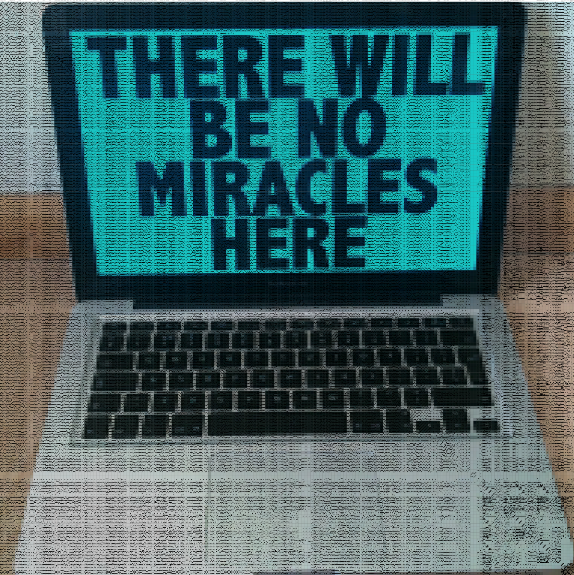
When looking at the image, it’s tempting to try and find some correlations that look significant and imagine a causal story. However, the text on the screen (taken from artist Nathan Coley’s work “There will be no miracles here“) reminds us that, while we’d like to believe that anyone could make a chance discovery that explains how language works, we must remain rational and keep in mind the bigger picture.
You can download the full image here (22MB). And here’s the R script that made the picture.
The Taal in Beeld exhibition will be on display throughout October in the central hall of the Mariënburg Library in the center of Nijmegen.
When reading that sentence I automatically interpreted “which shows how every linguistic variable in WALS correlates with every other variable” as *significantly* correlating…what a feat, Sean! I’m still suspecting you only put that graph out in order to obliterate your massive reporting bias.