![]() In a recent post, James wrote about the Social Sensitivity hypothesis. Given findings that certain genetic variants will make a person more sensitive to social contact and more reliant on social contact under stress, it proposes that certain genetic variants ‘fit’ better with certain social structures. In support of this idea, Way and Lieberman (2010) find a correlation between the prevalence of this variant and the level of collectivism (as opposed to individualism) in a society.
In a recent post, James wrote about the Social Sensitivity hypothesis. Given findings that certain genetic variants will make a person more sensitive to social contact and more reliant on social contact under stress, it proposes that certain genetic variants ‘fit’ better with certain social structures. In support of this idea, Way and Lieberman (2010) find a correlation between the prevalence of this variant and the level of collectivism (as opposed to individualism) in a society.
An alternative explanation I’ve been thinking about is migration patterns. If genetic differences make a person less reliant on social networks, they may be more likely to migrate. This would predict that areas settled later in human history will have more ‘non socially sensitive’ individuals.
Below is a map of the levels of different genotypes that affect social sensitivity:

As the second map below shows, areas with low prevalence of these genotypes were generally settled later (Europe, the Americas) than those with high prevalence (Africa, Asia).

Interestingly, the distribution of the social sensitivity genes also resembles the amount of migration in modern times:
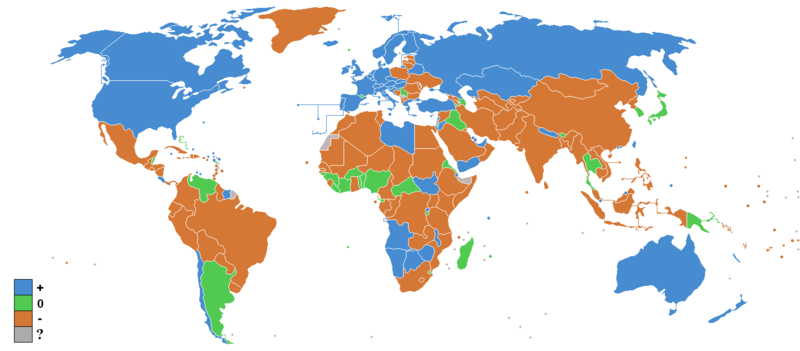
Of course, this may be more to do with wealth and freedom to migrate than genetics.
A Model of Migration and Social Sensitivity
In order to show that this is a viable hypothesis, I’ve been building a model (and you can mess around with it – see below!). A population is spread over an area and individuals compete for resources. Individuals reproduce and can migrate. When resources are low, individuals are subject to ‘stress’. An individual can die if there are too few resources to sustain the number of people in the local area. The chance of an individual dying is based on the amount of resources, the amount of support they have (the number of people in the surrounding area) and their genotype. There are two genotypes – one decreases the probability of dying under stress. There is a small chance of mutation during reproduction.
I wanted to see if the population would evolve so that areas with fewer resources would be colonised by non-sensitive individuals and areas with high resources would tend to retain sensitive individuals.
Setup
The model was run in a world with 40 x 40 areas. The resources of an area depended on its x and y coordinate, creating a map with high and low resource areas.

The advantage of the non-sensitive gene kicks in around 50% of full resources (first lighter blue bar), but also depend on the population of the area. A non-sensitive individual has a 30% survival probability advantage over a socially sensitive individual. This may seem high, but it makes the difference clear for the purposes of the model, and is based on actual data from Capsi et al. (2003):

Agents were removed from an area’s population if the amount of resources per agent went below a threshold or the area reached a maximum capacity (10 in this model). The latter measure was mainly to keep memory usage down. An agent’s chance of survival was based on a score calculated as the product of the amount of resources per agent, the population density of the surrounding area and the genetic advantage (if resources were low). The second term was just the number of agents in the current and surrounding areas divided by the maximum possible number of agents. This captures the amount of ‘support’ an agent has access to.
Each area could hold a maximum of 10 agents. To initiate the model, an few areas at the top of the map (high resource) were populated with socailly sensitive agents. Agents reproduce sexually, with offspring randomly selecting a parent’s gene. During reproduction there was 1% chance of mutation. At each time step, any agent had a 20% probability of migrating to a neighbouring area.
Below is a video of a run. White areas are unpopulated, orange areas have predominantly socially sensitive agents, blue areas have predominantly socially non-sensitive agents and green areas have a mixture of both types.
As predicted, the sensitive agents spread to the borders of the high-resource zone, but only non-sensitive agents venture further. Also, the communities in the low-resource areas are more isolated and more transitory.
Discussion
Genetic correlates of social sensitivity have an impact on migration patterns. Less sensitive individuals are more likely to migrate to harsher climates and away from large groups. This has a knock-on effect on an agent’s social network. Regarding Way & Liberman’s findings, it would be interesting to consider the interactions with migration patterns. Way & Liberman admit that their study could not control for the effect of drift because of lack of data. However, they did find that the correlation persisted when measures of latitude and historical climate were controlled for, which goes against my hypothesis.
This effect may have an impact on the evolution of language too: The type of social network may influence learning pressures, affecting how the language evolves.
The model is just preliminary (and you’re encouraged to do the real work of formalising the dynamics!). Depending on the parameters, the model does have other behaviours. If you would like a go at adjusting them, the source code for the model is available online. It’s written in python and uses matplotlib (for plotting the graphs) and ffmpeg (for creating the video). It’s supposed to be pretty easy-to-use, but it may not be totally clear – let me know if you’re having problems.
Possible extensions include:
- Including more realistic resource rules (e.g. seasons, real soil moisture level data), with added noise.
- Starting the model with a mixture of genotypes
- Putting physical bottlenecks into the map
- Extending the genotype difference to reflect the three-level distinction from Capsi et al.
I also need to look at models of germ reproduction – there are probably a lot of similarities.
Way, B., & Lieberman, M. (2010). Is there a genetic contribution to cultural differences? Collectivism, individualism and genetic markers of social sensitivity Social Cognitive and Affective Neuroscience, 5 (2-3), 203-211 DOI: 10.1093/scan/nsq059
Caspi, A., Karen Sugden,, Terrie E. Moffitt,, Alan Taylor,, Ian W. Craig,, HonaLee Harrington,, Joseph McClay,, Jonathan Mill,, Judy Martin,, Antony Braithwaite,, & and Richie Poulton (2003). Influence of Life Stress on Depression: Moderation by a Polymorphism in the 5-HTT Gene Science, 301 (5631), 386-389 DOI: 10.1126/science.1083968
wow. mad props. awesome post.
Like Razib said, awesome post. What version of Python did you use? I only ask because it doesn’t seem to work in my version (3.1.2).
What Razib said. Cool!
Yeah. Impressive Post once again. A Big tumbs up!
Wintz- check that you have matplotlib and numpy installed and try running using “python SensitivityModel.py”.