This week I discovered that an analysis using Causal Graphs that James and I did in 2013 has been backed up by more recent data. This demonstrates the power of Causal Graph analysis, which we’ll be discussing in our workshop on Causality in the Language Sciences (submission deadline extended!)
A recent paper demonstrates a correlation between various genetic factors and life history strategies (Minkov & Bond, 2015). Minkov & Bond find that the prevalence of three gene polymorphisms (5-HTTLPR serotonin transporter gene, the androgen receptor gene AR and the dopamine receptor gene DRD4) correlate with measures of how willing people are to take risks, such as long-term/short-term orientation.
We’re written before about 5-HTTLPR (here and here), which was previously associated with individualism/collectivism. However, the paper above, and a previous one in 2014 by Minkov, Blagoev & Bond, find that the correlation is stronger for long-term/short-term orientation.
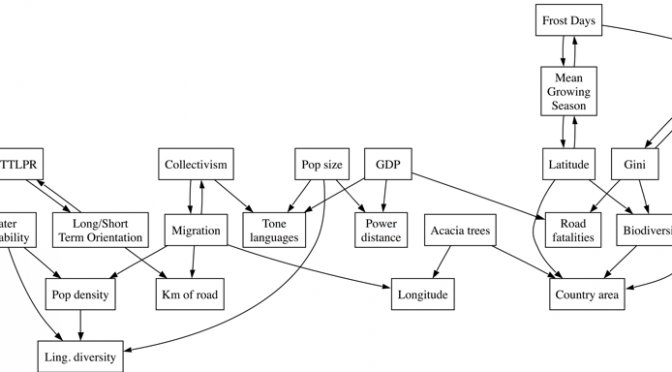
What’s interesting for us is that James and I predicted this in our 2013 paper on spurious correlations (the one with acacia trees and traffic accidents). Here’s figure 4 from our paper, which was generated using a causal graph algoritm (explained in more detail in this post):
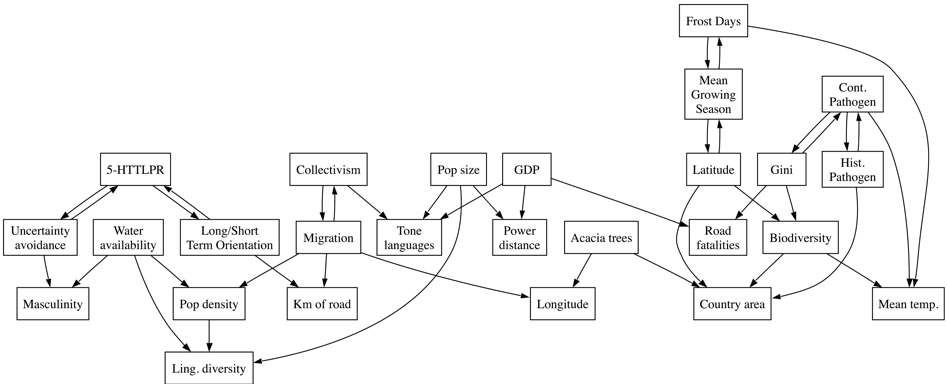
The relevant part is here, which predicts that 5-HTTLPR prevalence is causally related to Long-term/short-term orientation, but is causally independent from collectivism:
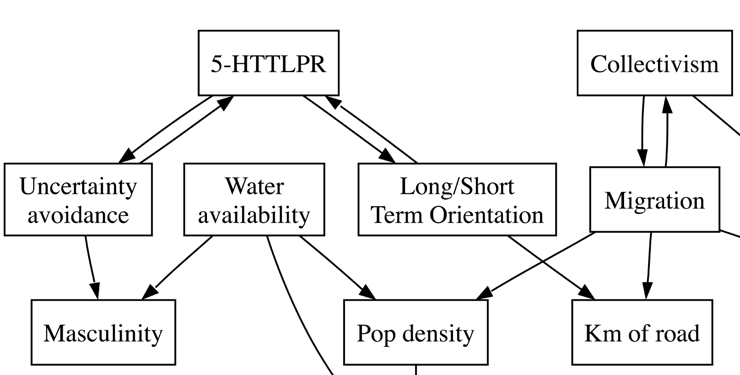
We suggested that the relationship between 5-HTTLPR and collectivism is mediated by the probability of migrating into harsher climates (a kind of risk-taking), and produced a computational model to demonstrate the principle (we also did some analyses which showed that measures of climate are correlated with 5-HTTLPR, but we haven’t reported these).
The more recent papers above also suggest that the genetic traits are linked with long-term/short-term orientation, but did so my greatly expanding the sample of genetic prevalence. So how did we get our result? In our analysis, we averaged 5-HTTLPR prevalence across countries, which is not realistic. This makes me worried that the correlations are being inflated by non-independence of the samples.
The authors are confident of the robustness of the correlation:
“If all these associations were spurious, their association would be miraculous, especially at the national-regional level. If there is no real association between the LHSGF and the reported measures of LHS and TO, what then explains the extremely high correlations?”
However, as our paper argues, spurious correlations are more likely when datapoints are linked through historical descent or borrowing (Galton’s problem). In the case of this paper, genetic traits are obviously historically related, and it’s likely that cultural values and life history strategies are also culturally transmitted.
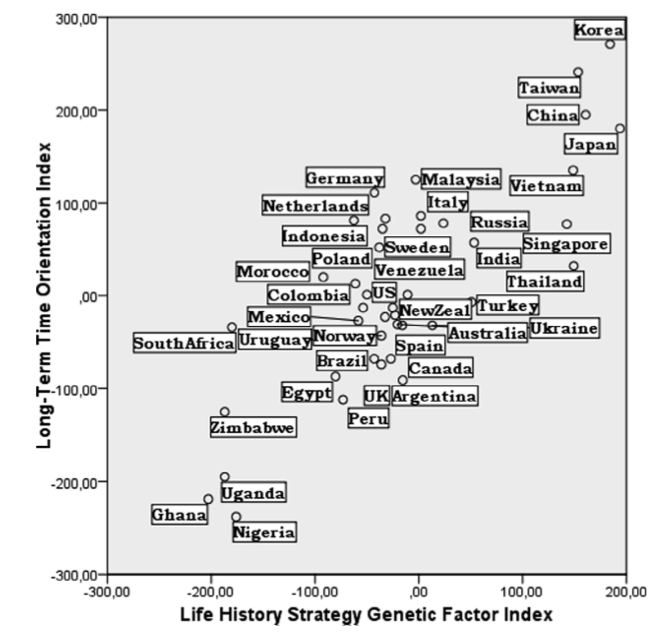
I tried testing whether the correlation is robust to historical or contact relationships. I used geographic proximity as a proxy for how closely related different cultures are. For each country, I found the geographic coordinates of the capital city. The graphs below demonstrate that there’s at least some geographic clustering (and a hit of a founder effect for the genetic data, as predicted by our migration model):
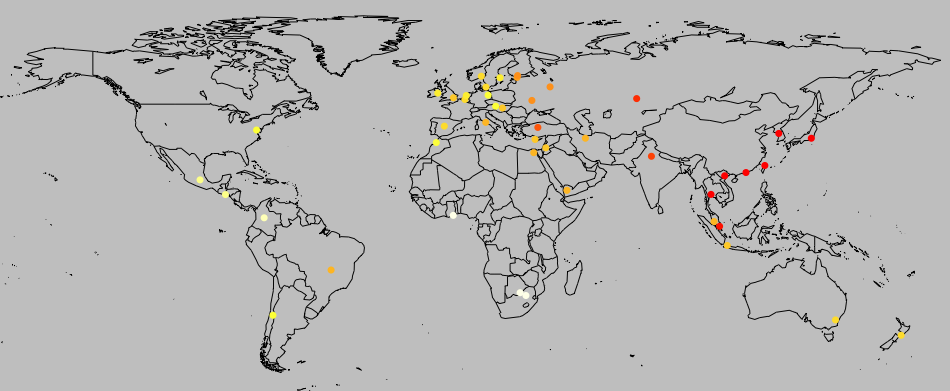
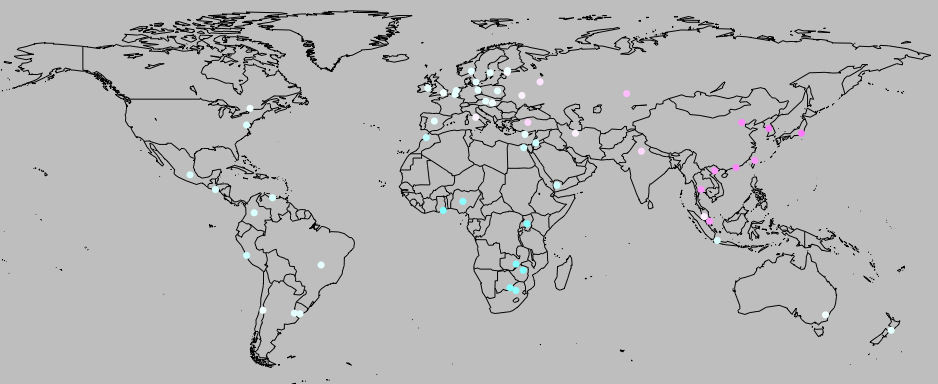
I then calculated the distance between each pair of countries in geographic terms (great circle distance), the National life history strategy genetic factor index and the genetic factors. (for the genetic factors, I did a principal components analysis, as in Mikov & Bond, and used the first component, which had an eigen value of 2.62 and explained 65.5% of the variance, compared to Mikov & Bond’s 2.04, and 68%).
This gives us three distance matrices: distance in miles, distance in life history strategy and distance in genetic traits. I then used a Mantel test to compare these.
Genetic and life history measures are correlated (r = 0.88, p < 0.0001), as in the paper above (in the regression, r = 0.78-0.84). Both the genetic and life history measures were correlated with geographic distance (r = 0.36, p < 0.0001; r = 0.27, p = 0.0003), which suggests that they are not independent (i.e. a country is likely to be more similar to its neighbour than a distant culture).
However, there is still a significant correlation between genetic and life history measures when controlling for geographic distance (r = 0.87, p = 0.0001). In fact, the correlation is barely affected at all when partialling out the geographic distance.
So, it appears that the correlation is somewhat robust to controlling for non-independence. But will it play out in the long-term?
Source data and analysis script: MikovBond_Mantel
Edit: Michael Minkov has been in touch, and argues that psychological phenomena, such as happiness, values, attitudes etc. can’t be borrowed across cultures. They depend on particular economic conditions, which also can’t be borrowed in the same way that a word or an artefact can be borrowed.
Edit2: Above, I used raw distance, but log distance is probably a better measure. Both genetic index and life history index are more strongly correlated with log geographic distance (r = 0.42, p < 0.0001; r = 0.35, p < 0.0001). However, there’s not much difference in the correlation between genetic and life history measures when controlling for log geographic distance (r = 0.86, p < 0.0001).