I vowed never to look at any more spurious correlations. But there is time for one final foray into the word of acacia trees and traffic accidents.
Some of my previous posts showed correlations between bizarre variables such as alcohol consumption and morphological complexity, acacia trees and tonal languages and the sonority of a language and the amount of extra marital sex that its speakers indulge in. Of course, the point was that cultural variables are likely to be correlated, even when they are not causally related, because of the way they spread. As populations migrate, they bring whole bundles of cultural features with them. See the article I wrote with James about this here.
There are some methods that try to account for this, such as Bayesian Phylogenetics. However, these models are quite complicated and can take a lot of time to run. Mostly, they are concerned with one or two cultural traits that we have some reason to think are linked. However, what do we do if we’re not even sure what we should be controlling for?
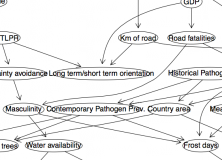
One possible method is Bayesian causal graphs. This is a method of figuring out the most likely causal graph given the correlations between variables. R has a package to build causal graphs called pcalg which is quite straightforward to use (maual here). I loaded up as many variables as I could and aggregated them by country. The causal graph is calculated by computing all the partial correlations between all sets of variables, then figuring out which ones are most significant. Here’s what I came up with (visualised with Gephi, click to make big):

Some interesting things come out. First, some elements make intuitive sense, like the contemporary pathogen prevalence relying on the historical pathogen prevalence and the Gini coefficient (how rich the country is). Variables like the number of frost days, mean growing season and mean temperature are linked.
Interestingly, this analysis suggests that linguistic diversity and road fatalities are not causally linked, although there is a strong correlation between them. Also, tonal languages and the presence of acacia trees are not causally linked. This is good news!
5-HTTLPR is a geneotype that has been linked to collectivism. Me and James worked on a hypothesis that the link between these two things came about because of a difference in migration patterns. The current graph suggests that there is no direct causal link between collectivism and the 5-HTTLPR geneotype, but they are linked through the levels of current migration. The link with population density and long/short term orientation also fits with our hypothesis of more independent people migrating into harsher climates. Me and James are currently working on a paper that uses statistics and modelling to argue this case.
Overall, the following picture falls out. Ecological factors, such as the availability of water, dictate the kind of interaction dynamics that are prioritised between people. This leads to different kinds of communication pressures which changes language in different ways:

There may be feedback in the other direction, as well. That is, coevolution!
While the graph above looks impressive and makes sense in some areas, it is quite unstable. Taking out some variables or cases leads to different links. Some links are more stable than others. For example, water availability and masculinity was quite robust.
It may be possible to do a kind of leave-one-out analysis, create lots of causal graphs and then bootstrap a most likely causal graph. That is, each edge would be probabilistic, just like branches on a phylogenetic tree. The advantage is that the graphs take almost no time to compute, even with relatively large datasets. Also, the graphs get more accurate the more variables you put in.
And now I really, really promise not to do any more spurious correlations.
… although keep an eye out for an article by me and James in the New England Journal of Medicine on a correlation between chocolate consumption and serial killers.
Roberts, S. & Winters, J. (2012) Constructing Knowledge: Nomothetic approaches to language evolution. In L. McCrohon, T. Fujimura, K. Fujita, R. Martin, K. Okanoya, R. Suzuki, N. Yusa, Five Approaches to Language Evolution: Proceedings of the Workshops of the 9th International Conference on the Evolution of Language. Evolang9 Organizing Committee
It would be quite interesting to apply a Bayesian MCMC model comparison to these and see whether you get a clear preference for one combination of variables over the other. You can use the approach you’ve outline above to narrow down a list of plausible (in spurious correlations land) models.