This coming week I’ll be at the Causality in the Language Sciences conference. One of the topics of discussion will be how to integrate theories of causality into linguistic work. Bayesian Causal Graphs are a core approach to causality, and seem like a useful framework for thinking about linguistic problems. However, it’s not entirely clear whether all questions in linguistics can be represented using causal graphs. In this post, I’ll discuss some possible uses of Bayesian Causal Graphs, and test the fit of some actual data to some causal structures. (and please forgive my basic understanding of causality theory!)
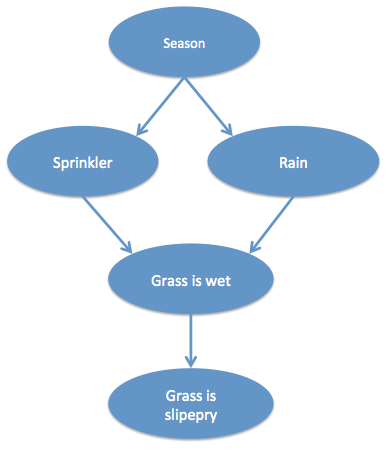
Causal graphs are composed of states connected by edges. A change or activation of a state causes a change in another. States and causes can be categorical and absolute, or statistical and even complex in their relations. Causal graphs are often introduced with the following kind of structure, taken from Pearl’s seminal book on Causality. The season causes it to rain (in winter) and causes the sprinkler to come on (in summer). Both the sprinkler being on and rain independently cause the grass to be wet. If the grass is wet, the grass becomes slippery:
This example is easy to understand because each state is binary and (in this simple world) each causal effect is immediate and direct. However, finding a similar example for linguistics is tricky. Linguists may simply not agree on what the nodes are or what the edges represent.
Here are some ways in which nodes and edges have been used in previous linguistic studies:
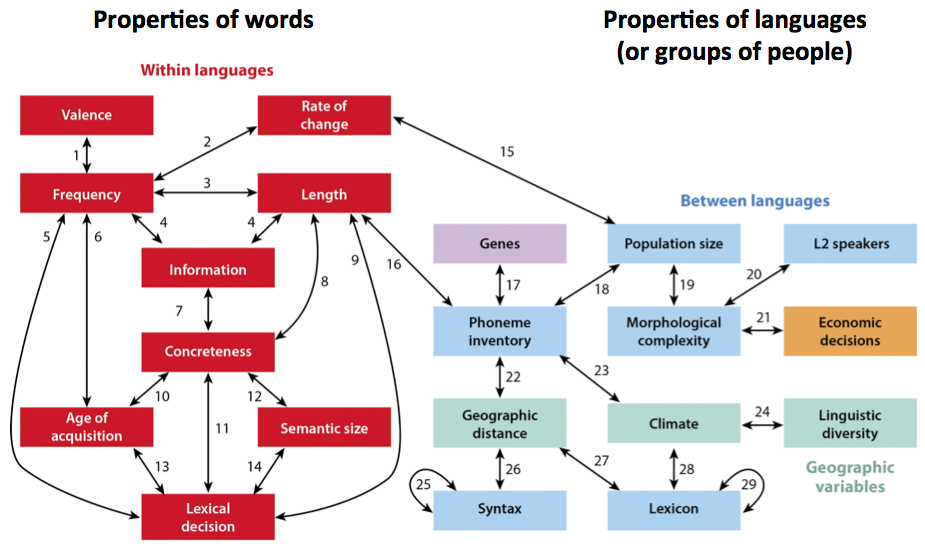
- Nodes as properties of words or languages, with edges being statistical links (e.g. Ladd, Roberts & Dediu, 2015):
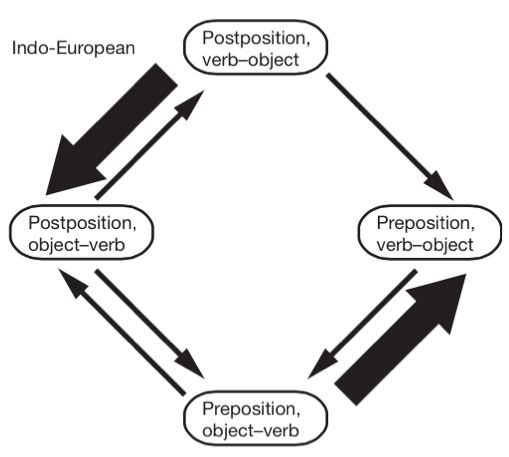
- Nodes as combinations of linguistic properties with edges representing likelihood of change between nodes (e.g. Dunn et al, 2011):
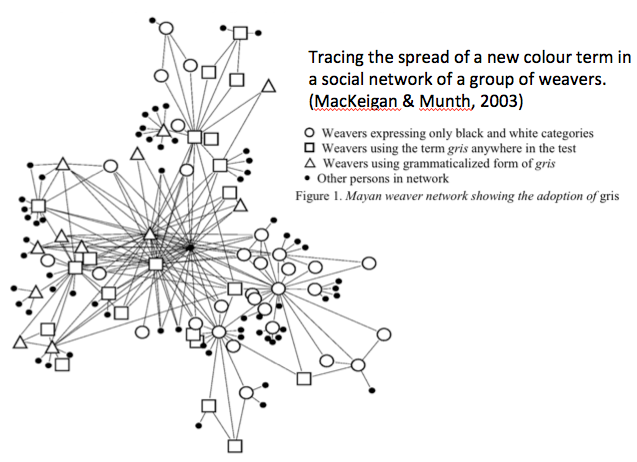
- Nodes as individuals in a social network with edges as social bonds or linguistic influence (e.g. MacKeigan & Munth, 2003, various sociolinguistic studies):
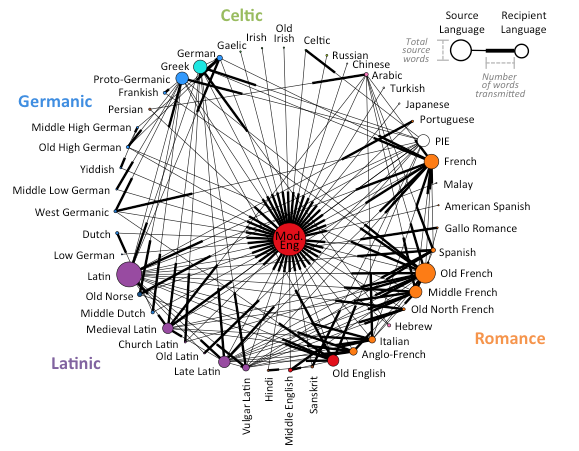
- Nodes as languages with edges as borrowing events (Roberts, in prep):
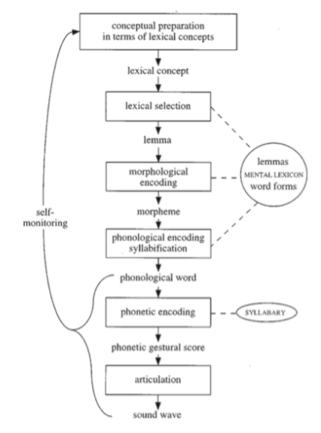
- Nodes as psychological processes and edges as time in word production (Levelt, Roelofs & Meyer, 1999):
Edges could also represent transmission of variants, a selection pressure (increase in X causes decrease in Y), the inheritance of features or the likelihood of transition between states. Often, however, what constitutes a node or an edge is very theory-specific, and often the actual underlying causal mechanism is hotly debated.
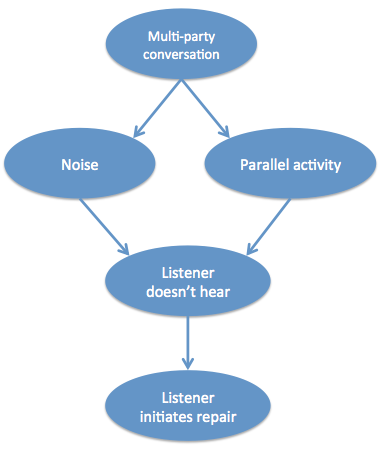
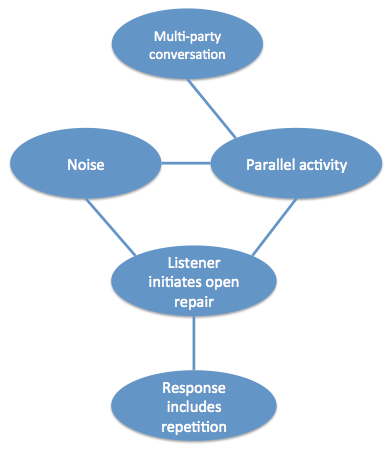
Here’s my attempt at a relatively uncontroversial example of a parallel graph to Pearl’s in the domain of linguistics. If there are lots of people in a conversation (instead of just 2), that causes noise and possible parallel activities. Noise and parallel activities may contribute independently to whether or not speaker 1 hears what speaker 2 said. If they don’t hear what has been said, they have no option but to initiate open repair (‘huh?’ or ‘what?’ or ‘I’m sorry?’), as opposed to a specific question about the previous turn.
Can we put this causal graph to the test with real data? Well, to begin, it’s almost impossible to measure whether a speaker actually hears what is being said. However, other aspects are measurable. I’ve been involved with a project by Mark Dingemanse, Nick Enfield and many others on the factors that influence how repair sequences are done. Our most recent work demonstrates dependencies between some of the features above: The probability of using open repair (‘Huh?’) versus restricted repair (‘Who had a baby?’) is related to whether there is noise and whether the listener is engaged in a parallel activity. The choice of repair initiator type then influences the kind of response that follows. For example, open repair is likely to elicit full repetition, while more restricted repair is likely to be followed by just the relevant information.
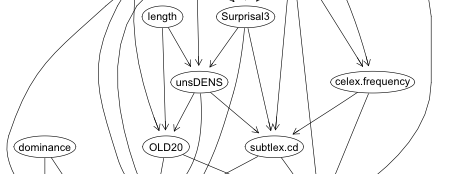
We can actually calculate the most likely causal graph from real data on conversational repair, using the PC algorithm (using the R package pcalg, also discussed here). The graph below is the result (for effect, I cherry-picked the alpha value = 0.08). It’s not a perfect match to the hypothesised graph – there are some different connections, and the orientation of the edges cannot be resolved, but it is fairly faithful to the overall idea.
The example above is similar to the Pearl example in that it’s easy to imagine categorical states and causes have immediate effects. However, extending causal graphs into an area like typology is more difficult.
Typology
It should be possible to represent patterns of diachronic change in a causal graph. Here is an attempt:
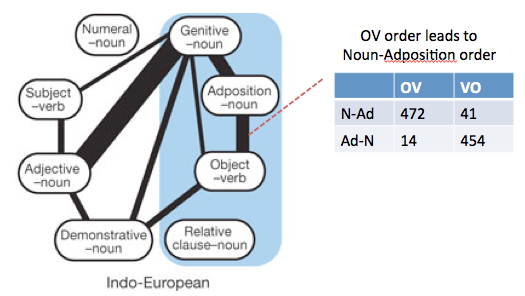
Different languages have different basic word orders. Some languages place the object before the verb and some place it after the verb. A historical change to one ordering may have a knock-on effect for the ordering of different elements. For example, if a language changes to have Object-verb order, it may also change to put adpositions after the noun (postpositions instead of prepositions). There are various theories about syntax and cognition that predict that this would happen based on parsimony of the syntactic tree or efficiency of cognitive processing. These changes lead to patterns in the word order rules of current languages (though the patterns are difficult to take at face value because of the non-independence of languages).
From Dunn et al. (2011):
The causal graph sketched below is one possible causal interpretation of the links discovered in Dunn et al. (and also hypothesised by others e.g. Greenberg).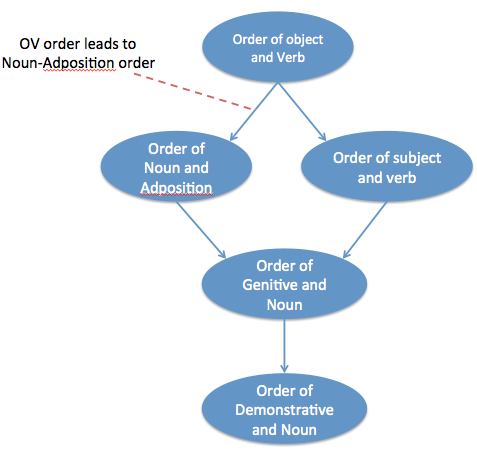
Quite aside from anything else, one can already see that this is more controversial, especially the edges.
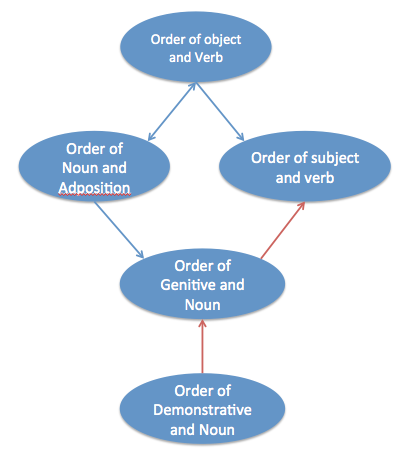
However, actual data align reasonably well with the proposed graph above. From WALS data, the following causal graph is produced using the PC algorithm. The structure is compatible with the assumed causal graph, although some edges are oriented differently (though this is a minor difference).
Historical relatedness
One problem with the analysis above is that the historical relationships between languages is not taken into account. Effectively, each langauge is taken as independent. One solution would be to alter the independence test used in the PC algorithm to adjust for non-independence. However, another approach would be to include historical influences as nodes in the graph.
For example, take the hypothesis about population size, L2 speakers and morphological complexity (Lupyan & Dale, 2010; Bentz & Winter, 2013). Bentz & Winters test whether the proportion of L2 speakers predicts morphological complexity (over and above population size), taking into account the phylogenetic and geographic relationships. One way to represent this would be the following:
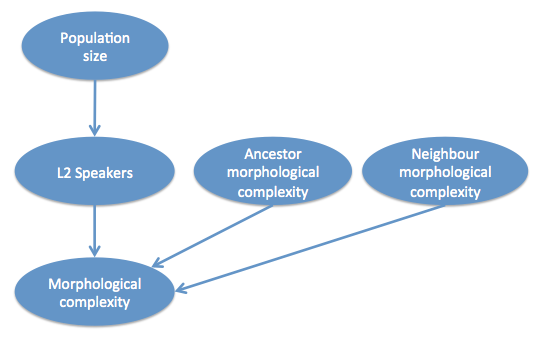
That is, morphological complexity of a language is a product of the proportion of L2 speakers (via contact), how morphologically complex the language’s ancestor was (via inheritance) and how morphologically complex the geographically neighbouring languages are (via contact). Note that a direct influence from population size to morphological complexity is not predicted.
I tried running the PC algorithm on the data from Bentz and Winter, though I didn’t go so far as to reconstruct ancestral states. There is not really enough data for robust results, but the following graph is produced (though now I’m really cheating by using an alpha value of 0.43, so this should just be taken as an example):
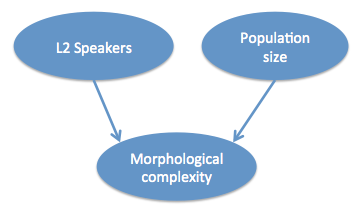
This suggests that L1 and L2 populations have independent contributions to morphological complexity. However, not also that the data predict the direction of the causality – from aspects of population structure to properties of the langauge (this can be done because the system represents a ‘collider’, which I don’t have time to into here).
One problem with this approach is that the number of nodes increases dramatically every time an extra linguistic variable is added.
Conclusion
So, representing linguistic processes as causal graphs seems possible and may be useful. It’s also possible to try to discover causal structures from real data. In the next post, I’ll discuss whether it’s possible to implement the notion of ‘intervention’ in these graphs, but already there’s plenty to discuss at the conference!
is the conversational repair data time stamped? if so, could be more useful to use granger causality framework.
Interesting point, and one which Fermin Moscoso del Prado has looked into : http://www.mis.mpg.de/fileadmin/pdf/abstract_coca_2710.pdf