A new paper by Monica Tamariz, myself, Isidro Martínez and Julio Santiago uses an iterated learning paradigm to investigate the emergence of iconicity in the lexicon. The languages were mappings between written forms and a set of shapes that varied in colour, outline and, importantly, how spiky or round they were.
We found that languages which begin with no iconic mapping develop a bouba-kiki relationship when the languages are used for communication between two participants, but not when they are just learned and reproduced. The measure of the iconicity of the words came from naive raters.
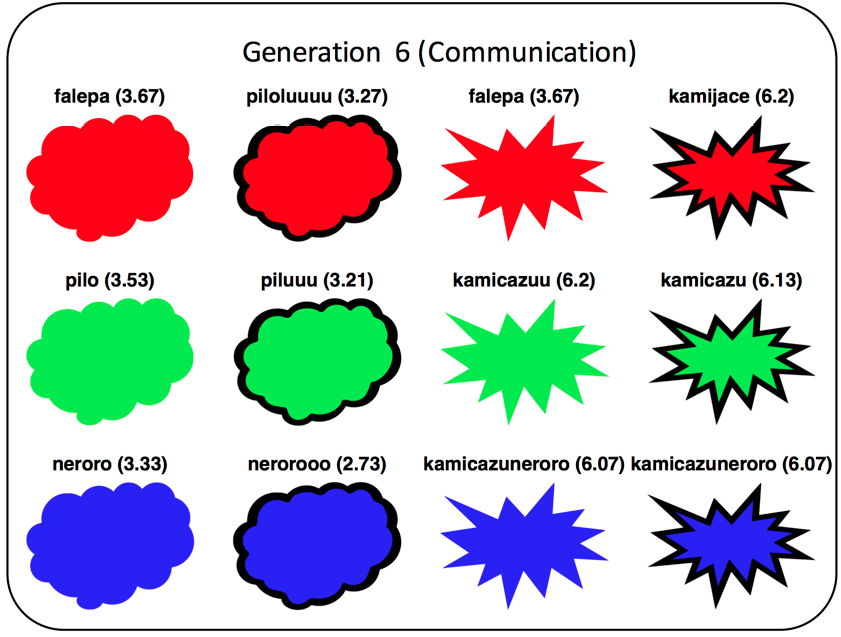
Here’s one of the languages at the end of a communication chain, and you can see that the labels for spiky shapes ‘sound’ more spiky:
These experiments were actually run way back in 2013, but as is often the case, the project lost momentum. Monica and I met last year to look at it again, and we did some new analyses. We worked out whether each new innovation that participants created increased or decreased iconicity. We found that new innovations are equally likely to result in higher or lower iconicity: mutation is random. However, in the communication condition, participants re-used more iconic forms: selection is biased. That fits with a number of other studies on iconicity, including Verhoef et al., 2015 (CogSci proceedings) and Blasi et al. (2017).
Matthew Jones, Gabriella Vigliocco and colleagues have been working on similar experiments, though their results are slightly different. Jones presented this work at the recent symposium on iconicity in language and literature (you can read the abstract here), and will also present at this year’s CogSci conference, which I’m looking forward to reading:
Jones, M., Vinson, D., Clostre, N., Zhu, A. L., Santiago, J., Vigliocco, G. (forthcoming). The bouba effect: sound-shape iconicity in iterated and implicit learning. Proceedings of the 36th Annual Meeting of the Cognitive Science Society.
Our paper is quite short, so I won’t spend any more time on it here, apart from one other cool thing: For the final set of labels in each generation we measured iconicity using scores from nieve raters, but for the analysis of innovations we had hundreds of extra forms. We used a random forest to predict iconicity ratings for the extra labels from unigrams and bigrams of the rated labels. It accounted for 89% of the variance in participant ratings on unseen data. This is a good improvement over some old techniques such as using the average iconicity of the individual letters in the label, since random forests allows the weighting of particular letters to be estimated from the data, and also allows for non-linear effects when two letters are combined.
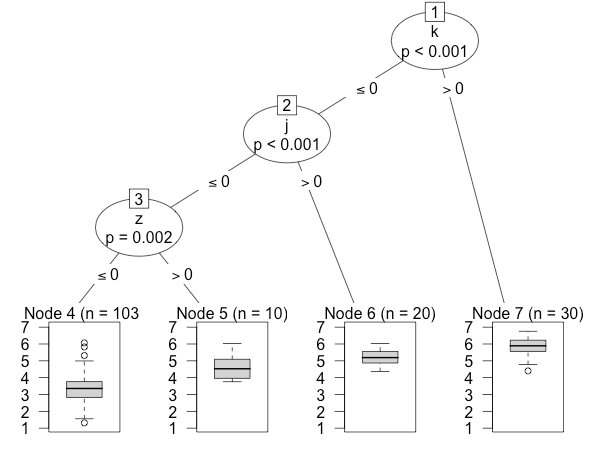
However, it turns out that most of the prediction is done by this simple decision tree with just 3 unigram variables. Shapes were rated as more spiky if they contained a ‘k’, ‘j’ and ‘z’ (our experiment was run in Spanish):
So the method was a bit overkill in this case, but might be useful for future studies.
All data and code for doing the analyses and random forest prediction is available in the supporting information of the paper, or in this github repository.
Tamariz, M., Roberts, S. G., Martínez, J. I. and Santiago, J. (2017), The Interactive Origin of Iconicity. Cogn Sci. doi:10.1111/cogs.12497, [pdf from MPI]