Who are the movers and shakers in your field? You can use social network theory on your bibliographies to find out:
Today I learned about some studies looking at social networks constructed from bibliographic data (from Mark Newman, see Newman 2001 or Said et al. 2008) . Nodes on a graph represent authors and edges are added if those authors have co-authored a paper.
I scripted a little tool to construct such a graph from bibtex files – the bibliographic data files used with latex. The Language Evolution and Computation Bibliography – a list of the most relevant papers in the field – is available in bibtex format.
You can look at the program using the online Academic Networking application that I scripted today, or upload your own bibtex file to find out who the movers and shakers are in your field. Soon, I hope to add an automatic graph-visualisation, too.
Here are the stats for papers on Language Evolution and Computation:
Nodes: 783
Edges: 691
A good measure of importance in the network (even better than page rank) is simply the degree- how many people you are connected to.
Top 10 authors by number of collaborators:
L Steels … 17
A Cangelosi … 15
S Kirby … 14
W S Wang … 9
M A Nowak … 8
M H Christiansen … 8
V Loreto … 7
D Ringe … 7
M D Hauser … 6
D Krakauer … 6
We can look at the top ‘brokers’ – authors that are vital links between clusters in the network. This is calculated as the highest betweenness-centrality.
Top 10 brokers:
L Steels … 0.010456
P Vogt … 0.008668
R A Blythe … 0.008098
S Kirby … 0.008031
A D M Smith … 0.007427
K Smith … 0.007338
M H Christiansen … 0.003025
S Valverde … 0.002383
V Loreto … 0.002153
B Corominas … 0.002108
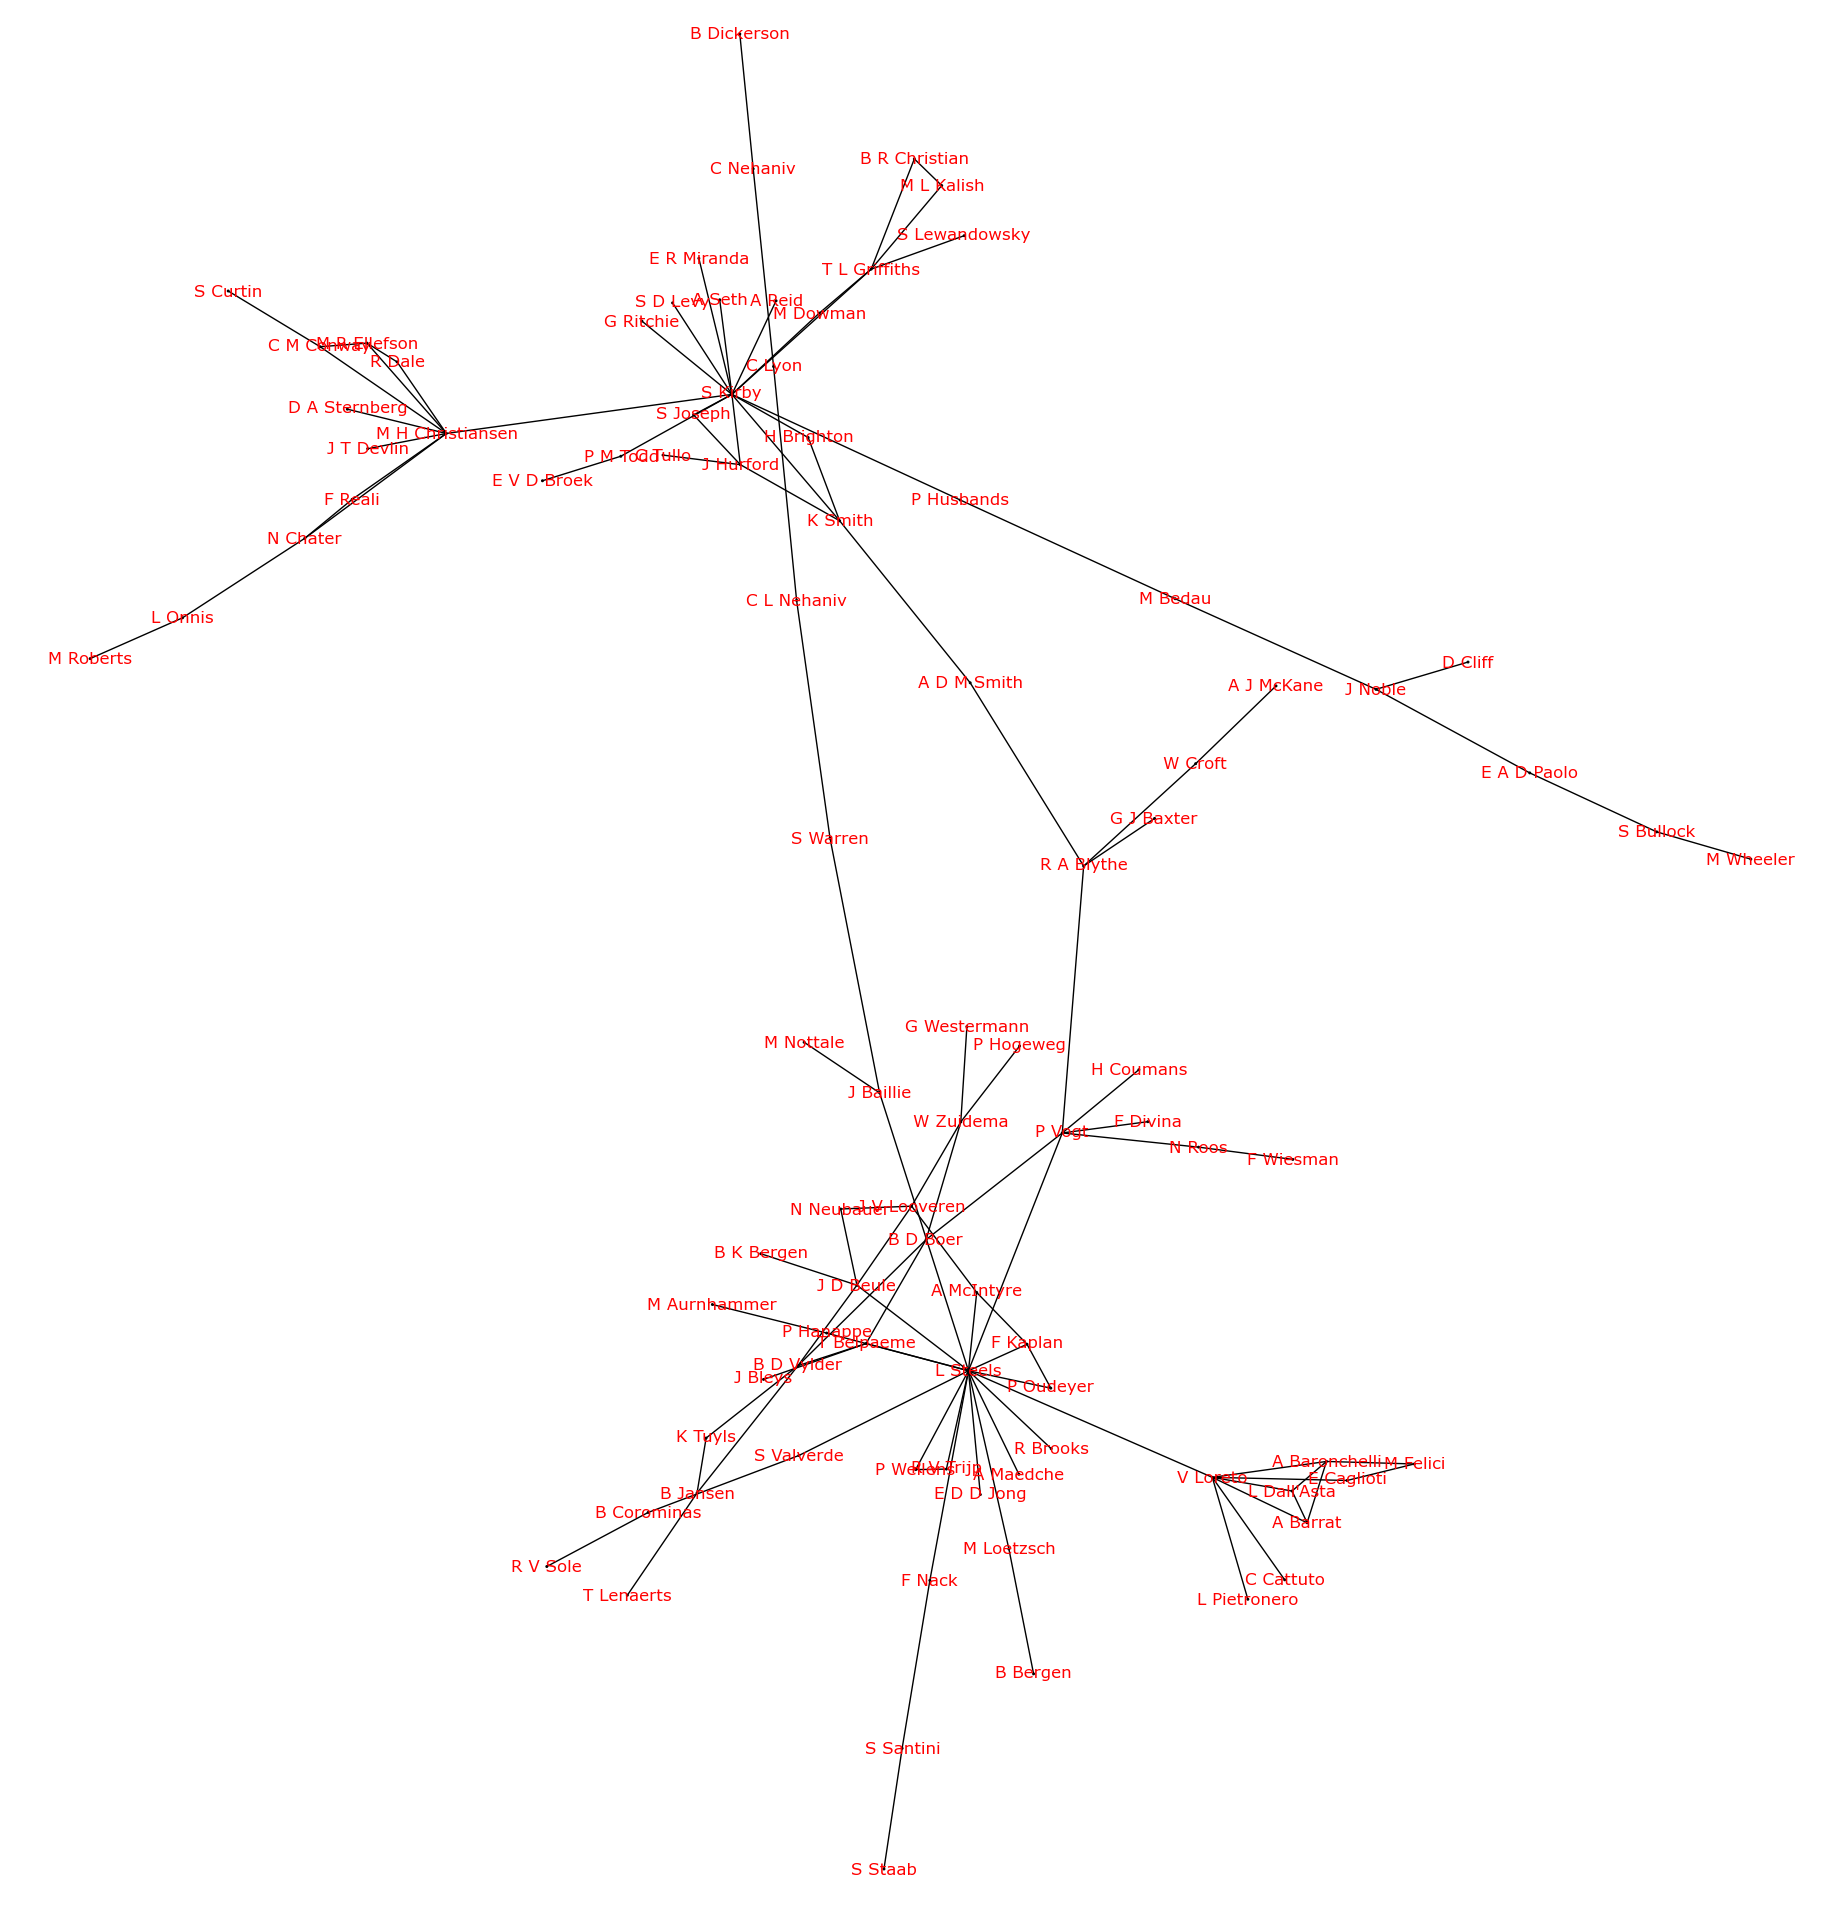
On my laptop (but not the server) I can create a network diagram of the largest component of the network – that is, the part of the network with the largest number of connected nodes. Here’s what it looks like for language evolution (this does not include all the authors in the database, click for a larger image):
You can see the legacies of different labs here – the LEC at the top and Luc Steel’s lab at the bottom
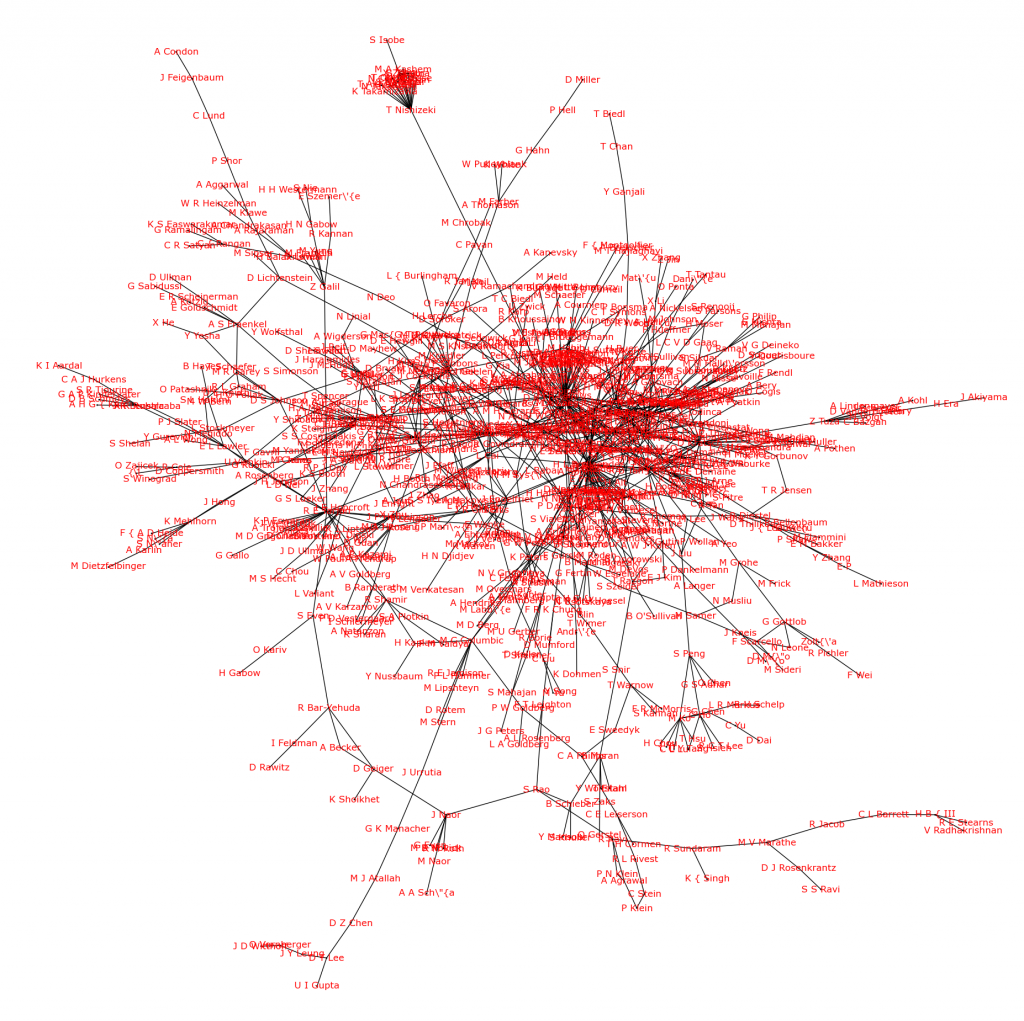
I also did a graph for publications about network theory. Note that this is just the largest component:
It seems like the field of network theory is more collaborative than language evolution!
Using my own bibliography produces expected results, except that it suggests I should try and collaborate with broker Brian Hare, who’s published with Michael Tomasello. However, this seems to be the result of a 7-author paper. This may mean it might not be useful for fields such as biology where there are typically many authors on each paper. The future algorithm should correct for that. For instance, I haven’t made the edges weighted, and I could modify the weights by the number of authors on a paper.
Add your own bibtex files to the online Academic Networking program – no guarantees it’ll work, though! I used python’s networkx module to calculate the statistics. You can see the script here. I can imagine many additions to this, but will leave it for another time.
SAID, Y., WEGMAN, E., SHARABATI, W., & RIGSBY, J. (2008). Social networks of author–coauthor relationships Computational Statistics & Data Analysis, 52 (4), 2177-2184 DOI: 10.1016/j.csda.2007.07.021
Newman, M. (2001). From the Cover: The structure of scientific collaboration networks Proceedings of the National Academy of Sciences, 98 (2), 404-409 DOI: 10.1073/pnas.021544898


very awesome!
You could probably use Mendeley for this. Do you have a Mendeley account, yet? It would be easier than a non-crowd-sourced bibtex file.