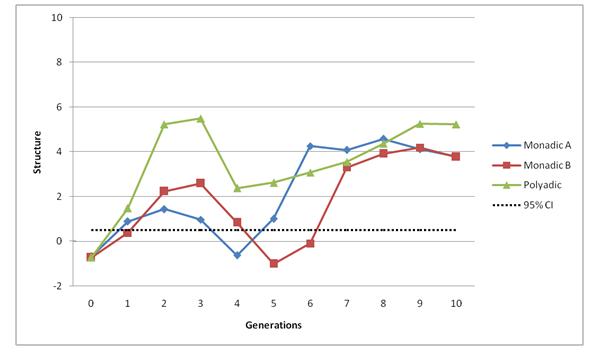
Measure of structure in both monadic and polyadic conditions across 10 generations. The monadic condition consists of two chains (monadic A & monadic B) plotted on the graph. As with the transmission error, the polyadic plot is an average of score taken from four chain combinations. The dotted line on the graph gives the 95% confidence interval so that any result above this line is indicative of being a non-random combination of meanings and signals.