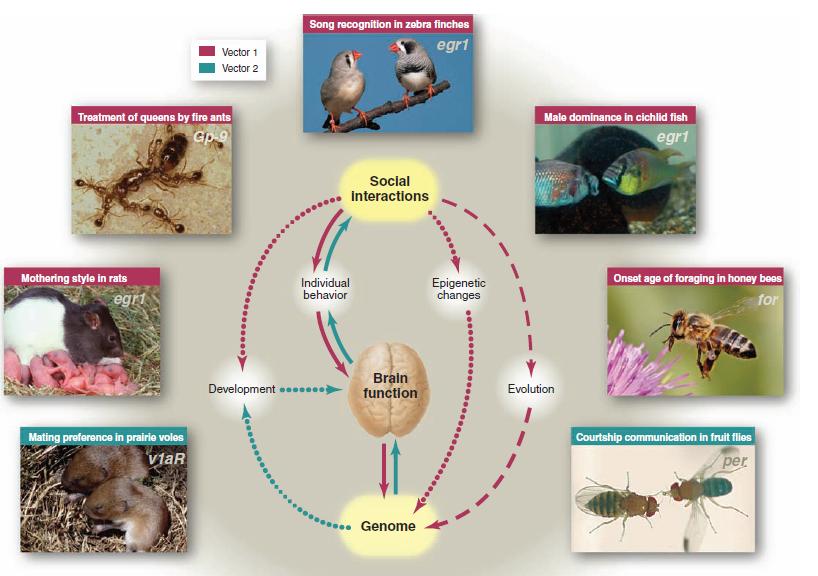
“Complex relationships connect genes, the brain, and social behavior. These relationships operate over three time scales: (i) physiological time via effects on brain activity (solid lines), (ii) developmental time via slower effects on brain development and genome modification (dotted lines), and (iii) evolutionary time via the processes of natural selection (dashed line). Arrow colors refer to Figs. 2 and 3 (pink, Fig. 2; blue, Fig. 3), which provide details about the nature of these interactions. Images depict some of the animals and genes featured in this review, clockwise from top: zebra finch (T. guttata), cichlid fish (A. burtoni), honey bee (A. mellifera), fruit fly (D. melanogaster), prairie vole (M. ochrogaster), rat (R. norvegicus), and fire ant (S. invicta).” (pg. 897)